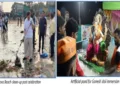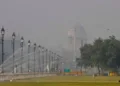




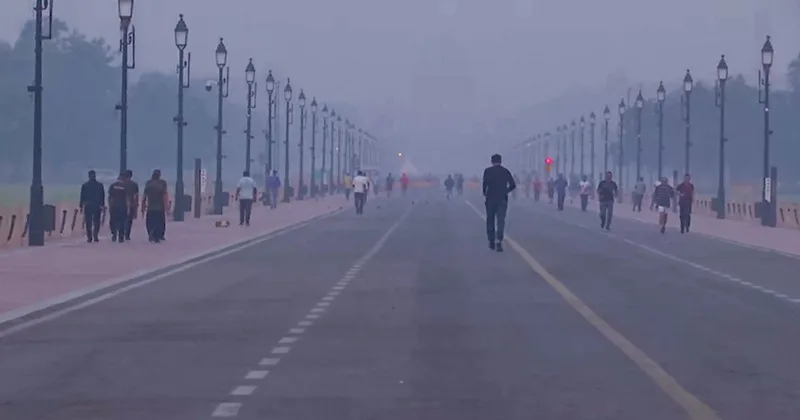
Every Deepawali, a familiar narrative dominates with headlines that fireworks are to blame for the choking smog which blankets northern India. Television debates and social media campaigns routinely turn the festival of lights into a festival of blame. This time Government and Environmental data present a more complex truth that India’s air pollution crisis goes far beyond Deepawali celebrations. The real story lies in year-round emissions, seasonal shifts and structural issues not in a few hours of festive fireworks.
The Real Picture: Beyond Delhi Festive Blame
Delhi is often portrayed as the face of India’s pollution problem. During winters its Air Quality Index (AQI) stays around 300–400, which is considered hazardous for human health. Each year this seasonal spike is immediately linked to Deepawali fireworks. A closer look at regional AQI data paints a different picture altogether.
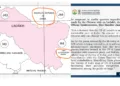
In 2025, Kapurthala has recorded an AQI of 1153, Jalandhar 1061, Ludhiana 798 and Amritsar 720 a level that surpass Delhi’s worst readings. These are the figures were recorded in Punjab not in Delhi. This proves that northern India air pollution is a regional and year-round issue, not a temporary one caused by firecrackers.
By blaming Deepawali alone, we ignore far more damaging contributors: vehicular emissions, stubble burning, industrial waste and unfavourable weather conditions. The festival lasts for one night, but polluted air clouds for months because of continuous and large-scale combustion activities.
Four Years of Air Quality: What the Data Shows
A study of AQI patterns between 2021 and 2024 at IIT Kanpur reveals how air quality has evolved over time. The data presented through box plots and line graphs identifies both seasonal variations and the long-term shifts in pollution intensity.
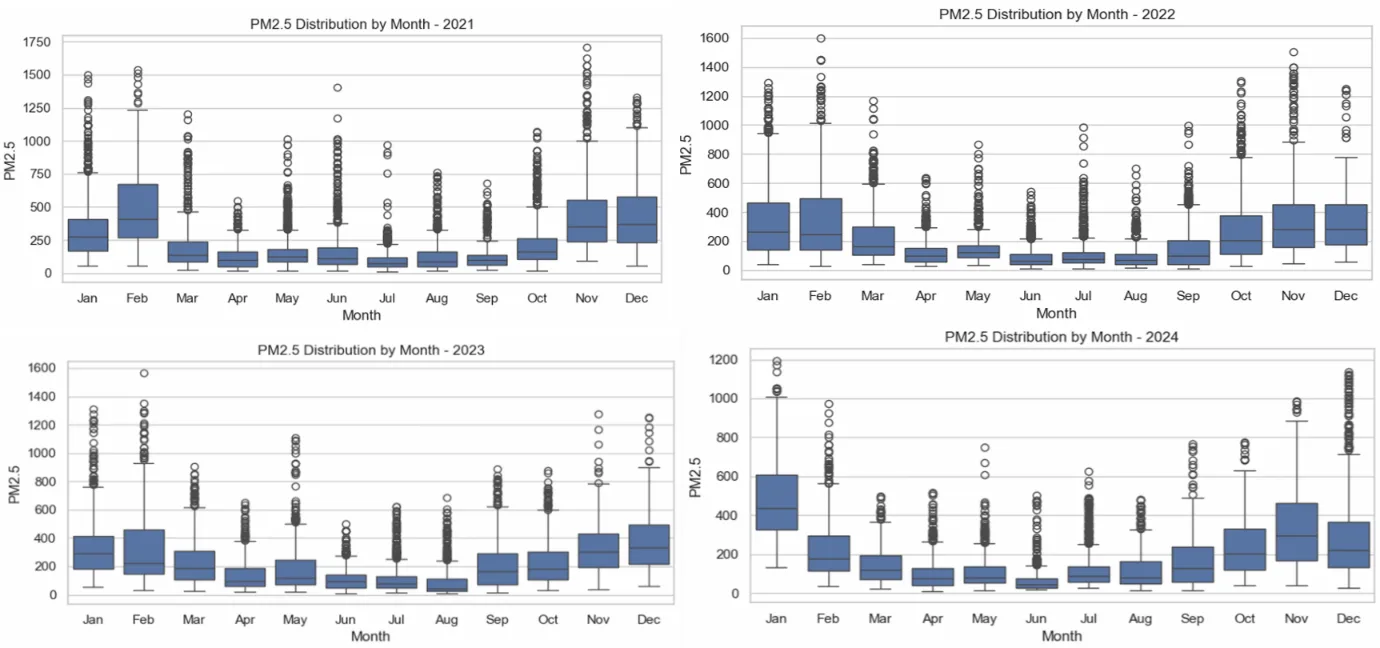
2021 and 2022 were among the worst years of the decade. AQI levels have showed high volatility, swinging between moderate and severe ranges. Peaks appeared most often in February and November, months outside the Deepawali period with average of 400+. This proves that pollution is not festival-specific but part of a recurring winter pattern.
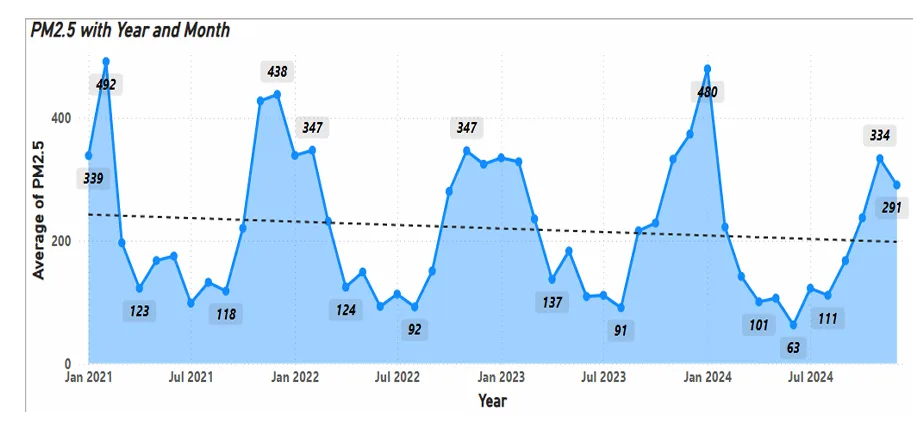
By 2023 air quality became stable to some extent with fewer high peaks. The Average AQI values were high which implies that although pollution variability has reduced, but the baseline was unhealthy.
The year 2024 saw some quantifiable improvement in numbers. The readings indicated narrower AQI, i.e. less fluctuation in air quality. Most months lay in the “moderate” or even in “good” category, with fewer days in the “severe” range. Punjab readings of above 1000 AQI in certain districts indicates that the issue still extends beyond Delhi and is firmly spread along the Indo-Gangetic belt.
Seasonal Story of Smog during Winter
Pollution in India has a distinct seasonal pattern, with strong meteorological and human factors. The pattern is confirmed by 2021–2024 AQI values.
Winter (November–February)
Winter evidenced consistently highest AQI with average values above 500 and 600. Low wind speeds, temperature inversion and trapping of pollutants near the surface by moisture cause dense smog layers. In 2021 AQI values were the highest of the decade, whereas 2024 presented modest improvement with slightly reduced AQI ranges.
Summer (March–June)
Summer brings temporary relief. More powerful winds and temperatures break the pollutants, although vehicular and factory emissions are also high. AQI readings remained primarily “moderate” with fewer extreme indicators in 2024, indicating higher stability.
Monsoon (July–September)
Monsoon rain falls loweres the pollutant concentration. Data for AQI during all years indicate that these months have the least polluted air, with the majority of areas reporting “good” or “moderate” levels. Rain cleanses suspended particles such as PM2.5 and PM10, thereby providing temporary span but much-needed relief against pollution.
Post-Monsoon (October–November)
This phase is when the transition from pure monsoon air to the winter polluted air takes place. AQI begins to increase long before Deepawali due to stubble burning in Haryana and Punjab primarily. Crop residue is burnt by farmers for preparing fields for the following sowing and thereby letting out massive amounts of carbon monoxide and particulate matter. Coupled with reducing temperatures and light winds, these emissions prove to be ideal for the buildup of smog.
When Deepawali comes, the air is already filled with pollutants. Firecrackers can result in short-term peak points, but they do not produce the bottom-line pollution. The AQI data clearly indicates that the worst pollution levels happen weeks prior to and following Deepawali not during it. This dot can be linked by the hourly data available.
The Invisible Pattern: Pollution by the Hour
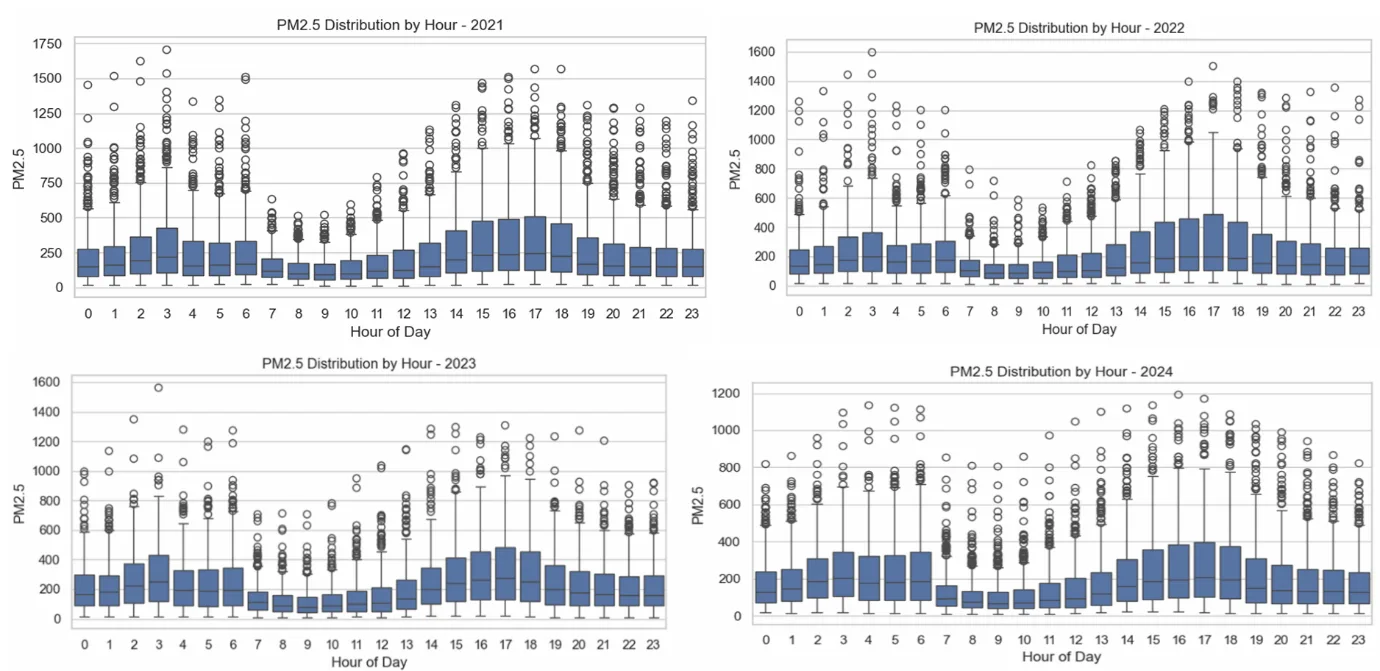
Indian air pollution also has a day-night cycle. Throughout all four years, morning and evening hours displayed the elevated AQI values. This is consistent with rush-hour traffic with peak average value of more than 200 and temperature inversion, with cold air trapping emissions close to the ground. From 7 a.m. to 1 p.m., as sunlight increases and air flow maximizes, pollution levels decrease radically.
Correlations values Revealing the Real Culprits
The correlation analysis of the AQI dataset reveals the strongest pollutant relationships and their probable sources.
• PM2.5 ↔ CO (0.93) and PM10 ↔ CO (0.92): These represent a high correlation between particulate matter and carbon monoxide, reflecting vehicular exhaust and biomass burning as the common sources.
• PM2.5 ↔ SO₂ (0.50) and NO₂ ↔ CO (0.41): These indicate moderate correlations reflecting industrial combustion and fossil fuel combustion as primary sources.
• SO₂ ↔ CO (0.54): Reflects the effect of industrial effluents and coal-based power.
• O₃ (ozone) exhibits a negative relationship with primary pollutants, such that ozone increases when other pollutants decrease. This typically occurs under strong sunlight in cleaner air, highlighting its secondary not direct production process.
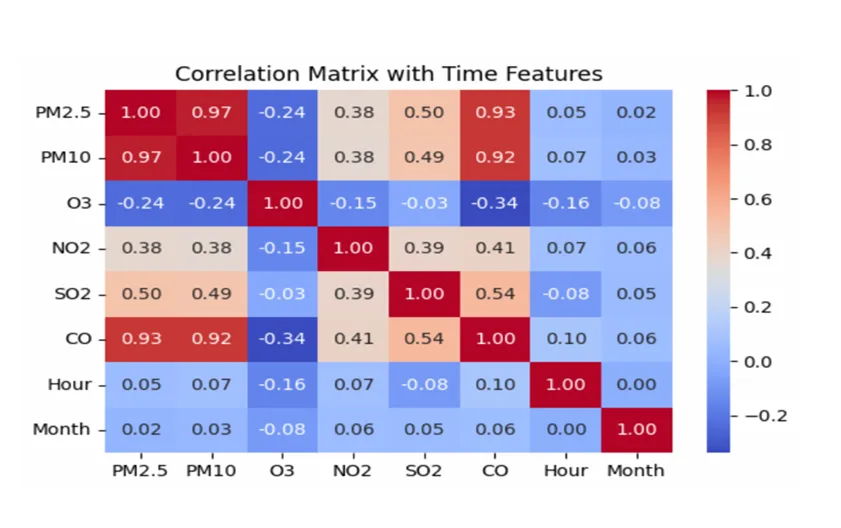
The scientific conclusion is plain: fireworks are not the primary source of sustained air pollution. Ongoing sources such as automobiles, industries and agricultural fires cause far greater long-term degradation of AQI. Firecrackers on the other hand produce a brief, transient peak in particulate concentration that occurs within 24–48 hours.
Air Pollution Regional Problem not a Festive
When Punjab’s AQI crosses 1100 while Delhi’s remains around 350, it’s evident that pollution is not a festival-driven event. The crisis extends across regions, connected by shared air corridors and agricultural practices.
The consistent rise in AQI during October–November each year reflects the post-harvest burning cycle not the Deepawali calendar. Yet, the national discourse repeatedly project fireworks as the primary villain.
This selective focus not only warps the actual cause but also complexes culturally meaning and traditional practices. Firecrackers persist for hours but industrial smoke stacks and burning fields release pollutants for weeks. By focusing on cultural events rather than on chronic polluters, public focus is shifted away from the necessity for greater policy change.
The statistics reveal that 2023 and 2024 saw slight turns for the areas of air quality, particularly in Delhi. This was a result of the regulatory actions, improved stubble treatment and greater awareness and not due to the prohibition of fireworks. It highlights that how continuous and evidence-based interventions prove more effective than symbolic seasonal prohibitions.
Pollution Is Policy-Driven, Not Festival-Driven
The evidence from 2021–2024 bust the myth that Deepawali is to blame for India’s polluted air. From Kapurthala staggering hazardous AQI of 1153 to Delhi moderate-high 350, the data clearly points to deeper and structural causes. The recurring smog is the product of stubble burning, vehicular congestion, industrial emissions and unfavourable meteorology not by the night of celebration.
Deepawali might momentarily spotlight the issue, but it doesn’t cause it. The air quality emergency persists long after the lights have gone out because the real sources never cease to emit. It’s time to look beyond symbolic coexistence and recognize that Indian pollution is a 365-day issue, not a one-night show. Festivals and sustainability can go hand in hand when informed by data, awareness and balanced environmental stewardship.
The journey of 2021 to 2024 already demonstrates a modest but consistent line of progression. The lesson is very much evident that “pollution is the child of neglect, not celebration”. If India wants to breathe fresh air, it needs to address its system emissions not its customs.