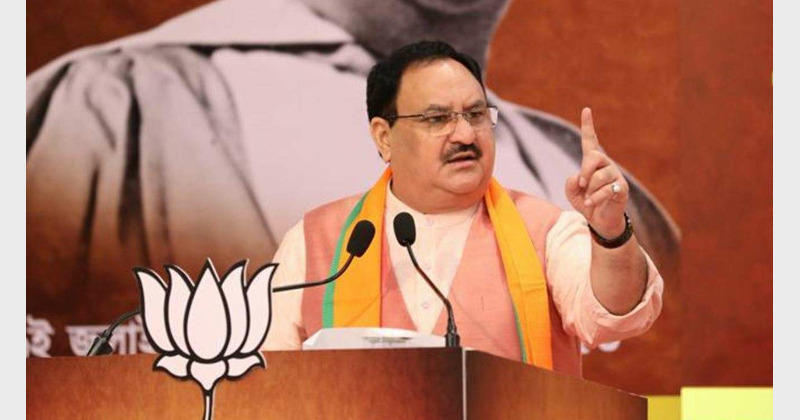
 |
|
Previous Issues
|
|
September 04, 2011
|
|
August 28, 2011
|
|
August 21, 2011
|
|
August 14, 2011
|
|
August 07, 2011
|
|
July 31, 2011
|
|
July 24, 2011
|
|
July 17, 2011
|
|
July 10, 2011
|
|
July 03, 2011
|
|
June 26, 2011
|
|
June 19, 2011
|
|
June 12, 2011
|
|
June 05, 2011
|
|
May 29, 2011
|
|
May 22, 2011
|
|
May 15, 2011
|
|
May 08, 2011
|
|
May 01, 2011
|
|
April 24, 2011
|
|
April 17, 2011
|
|
April 10, 2011
|
|
April 03, 2011
|
|
March 27, 2011
|
|
March 20, 2011
|
|
March 13, 2011
|
|
March 06, 2011
|
|
February 27, 2011
|
|
February 20, 2011
|
|
February 13, 2011
|
|
February 06, 2011
|
|
January 30, 2011 |
|
January 23, 2011 |
|
January 16, 2011 |
|
January 09, 2011 |
|
January 02, 2011
|
|
December 26, 2010 |
|
December 19, 2010 |
|
December 12, 2010 |
|
December 05, 2010 |
|
November 28, 2010 |
|
November 21, 2010 |
|
November 14, 2010 |
|
November 7, 2010
|
|
October 31, 2010
|
|
October 24, 2010
|
|
October 17, 2010
|
|
October 10, 2010
|
|
October 03, 2010
|
|
2010 Issues
|
|
2009 Issues
|
|
2008 Issues
|
|
2007 Issues
|
|
2006 Issues
|
|
|
November 08, 2009
Page: 28/42
Home > 2009 Issues > November 08, 2009
|
|
Open Forum
UPA is hampering the long-term growth of India The true picture of maneconomics
By VK Singh
A hyper-inflation (as of today) is very tricky, as the value of goods produced in terms of Indian rupee is inflated hence leading to increase in the figure of goods and services produced in the country, which automatically pushes the GDP of the country, without effecting the real production of goods and services in the country, hence reflecting artificial growth.
Agriculture is the predominant occupation in India, accounting for 60 per cent of employment, service sector makes up 28 per cent and industrial sector 12 per cent. In terms of output, the agricultural sector accounts for 28 per cent of Gross Domestic Product (GDP); the service and industrial sectors make-up 54 per cent and 18 per cent respectively. India’s GDP is US$ 1.089 trillion, which makes it the twelfth-largest economy in the world or fourth largest by purchasing power adjusted exchange rates. India is fifteenth in services output and provides employment to 23 per cent of workforce, and is growing fast at a growth rate of 7.5 per cent during 1991-2000, up from 4.5 per cent during 1951-80. It had the largest share in the GDP, accounting for 55 per cent in 2007. India’s IT industry, despite contributing significantly to its balance of payments, accounted for only about one per cent of the total GDP or 1/50th of the total services in 2001.
According to statistics of WTO in 2006, India’s total merchandise trade (export + import) was valued at 294 billion dollars in 2006 and India’s services trade inclusive of export and import was 143 billion dollars. According to The CIA Factbook (2007), India is a net importer. Total imports stood at US$ 224 billion and exports were US$ 140 billion. International trade as a proportion of GDP reached 24 per cent by 2006, still relatively moderate. India currently, accounts for 1.2 per cent of world trade as of 2006, according to WTO. Until the liberalisation of 1991, India was largely and intentionally isolated from the world markets, to protect its fledgling economy and to achieve self-reliance.The FDI inflow for 2007-08 has been reported as $ 24 billion. This is mainly due to the heavy returns the FIIs’ are making owing to the speculative returns gained through Indian stock markets. In 2006, remittances from Indian migrants overseas made up $ 27 billion or about 3 per cent of India’s GDP.
The Indian GDP has come a long way since its balance of payment’s downturn in the 80s. This can be largely attributed to the open policies of the government under the then Prime Minister Shri Atal Behari Vajpayee in 2003, attracting high influx of foreign investors. India’s BPO sector and service industry have also benefitted from its rapid growth of information technology, further strengthening its impressive growth and thus providing promising outlook for future growth. The contribution of IT to GDP increased to 4.8 per cent in 2005-06.
India’s nominal per capita income US$ 977 is ranked 128th in the world. 85.7 per cent of the Indian population was living on less than $ 2.50 (PPP) a day in 2005, compared with 80.5 per cent for Sub-Saharan Africa, with over 83.6 crore of the Indian population earning an income of less than Rs. 20 per day. Half of children are underweight, one of the highest rates in the world and nearly double the rate of Sub-Saharan Africa.
Gross Domestic Product is the sum of all goods and services produced in a country. This sum is the value measured in terms of rupee. Inflation in general terms is defined as more money chasing few goods. Hence a mild inflation is necessary to keep the economy progressing. India projected a lower inflation rate in 2008 from the 5.77 per cent reported in 2007. By July 2008, the key Indian inflation rate has surpassed the 11 per cent mark to become the highest rate recorded in last 13 years, and almost three times higher than the 4.1 per cent targeted by the Reserve Bank of India (RBI) in 2007. However, hyper-inflation (as of today) is very tricky, as the value of goods produced in terms of Indian rupee is inflated hence leading to increase in the figure of goods and services produced in the country, which automatically pushes the GDP of the country, without effecting the real production of goods and services in the country, hence reflecting artificial growth.
Stock exchanges are defined as the barometer of an economy. Shares, securities and bonds of various companies and PSUs are listed and openly traded daily there by the investors and institutions. Hence, those companies and sectors of the industries that are performing well are in demand and their prices are ever rising. Manmohan Singh’s tenure as a Finance Minister and currently as the Prime Minister has seen the largest fluctuation of Indian stock market, where the market has seen the highest up-swings and downwards speculative movements, inviting speculative trading instead of investments in the economy, the basic purpose which the stock exchanges serve. The Indian public lost heavily during this period, at the cost of FIIs and financially strong and prudent Institutions. On October 24, 2008, the Indian investors lost Rs. 3.3 lakh crore in a single day.
The Capital Market survey of data for 2,000 companies in India in August 13, 2007 issue reported the huge jump in other incomes of companies mainly due to large gains on hedging foreign exchange (forex) receivables and translation of forex liabilities. Companies that have raised substantial funds in forex were major gainers. The sharp rise in rupee against dollar and increase in refinery margin lifted profits and/or reduced the losses of PSU oil refineries. Forex gains helped airlines post profits against losses. The air-conditioner industry had an exceptionally strong quarter due to high demand growth as well as benefits from rupee appreciation. Similar was the case of commodity exchange where prices of foodgrains were hiked and manipulated and was speculative, though in actual terms the economy of goods (both agriculture and industrial) did not show any positive growth. Industrial output, which has been slowing down for some time with industrial production for October 08 down -0.4 per cent from 12.2 per cent in October 07, -1.2 per cent in February 2009, -2.3 per cent in March 09. This is the first time in last 15 years that year to year growth has been negative for any month.
All major economic indicators are showing signs of a negative growth. There is large scale unemployment and worker and employees are regularly losing jobs and facing pay-scale cuts. Still there are no signs of stopping of inflation and goods of the common man use have risen to sky-high prices. There are statements from UPA ministers of shortage of production of certain essential grains and items of mass consumption and in favour of promoting of price rise. Interestingly the industrial growth has picked up from 2.7 per cent in May 09 to 8.2 per cent in June 09 in consonance with the price rise, and immediately after the UPA was voted to power. This is despite the fact that our Prime Minister and his team are wellknown economists and the PM has served the RBI as an employee and Governor for several years. Hence, he is well versed with the monetary and fiscal measures employed to control Indian inflation and price rise. Maneconomics has always been aimed at a short-term gain and based more on the supply of money than other realistic measures which would serve the long-term strategic interest of the country. The blame for price rise is shifted on State governments though all macro and micro-economic measures to control price rise are with the central government. It appears that the Manmohan Singh government is purposely promoting inflation in order to show higher GDP growth, though in actual production and quantitive terms the Indian GDP is showing a negative growth. It is this window-dressing approach of the Central government that is hampering the overall long-term economic growth of the country.
(The writer is Executive Member, National Trade Cell, BJP. He can be contacted at B-78, Peoples Co-Operative, Kankarbagh Colony, Patna-800 020; E-mail: snghvk@yahoo.com)
|
Previous Page (27/42) - Next Page (29/42) 
|
|
|